


One shift, five OEE values: which calculation decisions determine your KPI
No one in manufacturing needs an explanation of how OEE is calculated. What is less widely known is how much the value for the same shift can vary depending on the definitions behind the three factors. In our calculation example, the OEE for a single shift ranges from 51.9% to 71.1%, depending on the calculation method, even though nothing about the machine’s operation has changed. This article examines the five decisions that explain this difference and shows what a robust calculation specification must define.
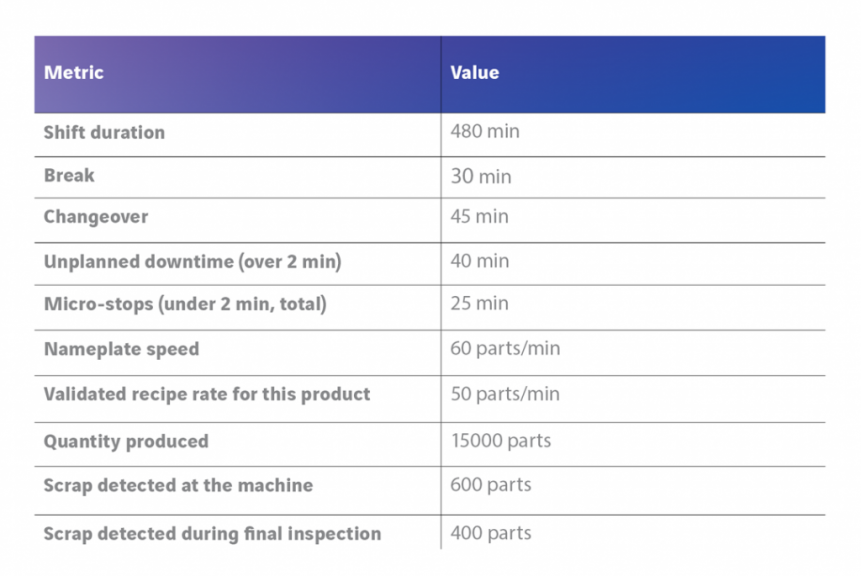
The calculation example: one shift on one line
All figures in this article are based on a constructed example, not an actual measurement. They have been selected so that each effect can be recalculated. In all variants, the break is treated as non-scheduled time, leaving 450 minutes.
Decision 1: What is the reference time?
Availability compares operating time with a reference time. The choice of reference time determines the nature of the KPI. Classic OEE is based on planned production time. When total operating time is used, this is often referred to as OOE, and when calendar time is used, as TEEP. Within OEE, the difficulty arises with time categories that cannot be assigned unambiguously, such as changeovers, preventive maintenance, cleaning, test runs, missing material or staff shortages.
In the example, treating changeover time as a loss results in availability of 75.6% and OEE of 51.9%. If changeover is treated as planned downtime and removed from the reference time, availability rises to 84.0% and OEE to 57.6%. Both definitions are defensible. The first makes changeover time visible as an improvement opportunity, while the second separates equipment performance from production-planning decisions. It becomes problematic only when both variants coexist, for example because one plant records changeover as planned and another does not. Management is then comparing two KPIs that share only the same name.
If changeover is excluded from OEE, it needs its own KPI. Otherwise, a real loss disappears from view.
Decision 2: Where do micro-stops belong?
Every system needs a threshold above which a stop counts as downtime. Stops below the threshold are not included in availability. Instead, they reduce performance because fewer parts are produced during the remaining operating time. Whether the threshold is set at 30 seconds, two minutes or five minutes is a definition, not a natural constant.
The example shows an effect that is often overlooked in discussions. If the 25 minutes of micro-stops are treated as a performance loss rather than downtime, availability rises from 84.0% to 90.1%, while performance falls from 88.2% to 82.2%. OEE remains at 69.1%. The overall figure is therefore unaffected, but the breakdown is not. Those who manage by availability will send in maintenance. Those who manage by performance will investigate material, cycle rate or operation. An incorrectly defined threshold therefore does not produce an incorrect OEE, but it does lead to the wrong actions.
Data collection is another factor. If the gateway queries the machine status only once per minute, many micro-stops are not visible at all. They then appear only indirectly as a performance loss, without a cause or frequency.
Decision 3: Which reference rate applies?
The performance factor is only as meaningful as the rate used in its calculation. Options include nameplate speed, the best performance ever achieved, a validated rate for each product or recipe, or a planned value from the ERP system. In the example, this decision has the greatest impact: at 60 parts per minute according to the nameplate, performance is 73.5%; using the validated recipe rate of 50 parts per minute, it is 88.2%. OEE jumps from 57.6% to 69.1%.
Both extremes have side effects. A standardised nameplate value penalises lines producing demanding products and makes plant comparisons dependent on the product mix. Conversely, an overly cautious planned value leads to performance values above 100%. This is a reliable sign that the reference value is wrong, not that the line is performing exceptionally well.
A robust approach is to use a validated rate for each product, transferred with the production order from the ERP or MES and versioned whenever it changes. This also explains why the context must be transmitted at the same time: without knowing the product currently being manufactured, the platform cannot determine the correct reference rate.
Decision 4: Where and when is quality counted?
In the example, the machine detects 600 scrap parts itself, while a further 400 are identified only during final inspection. If the system considers only scrap detected at the machine, the quality factor is 96.0%; when final inspection is included, it is 93.3%. OEE therefore varies between 69.1% and 71.1%.
The difference is small, but the consequences are not. If final inspection is included, the OEE for a shift is not complete until days later. A real-time dashboard then displays a provisional value that changes retrospectively, and this must be clearly visible to all users. Further definitions concern rework (does a reworked part count as good?), start-up scrap after changeover (a quality loss or part of the changeover process?) and sample and inspection parts.
The example at a glance
The same shift, the same machine, the same quantities. Each row adopts the definitions from the preceding row and changes one additional definition.
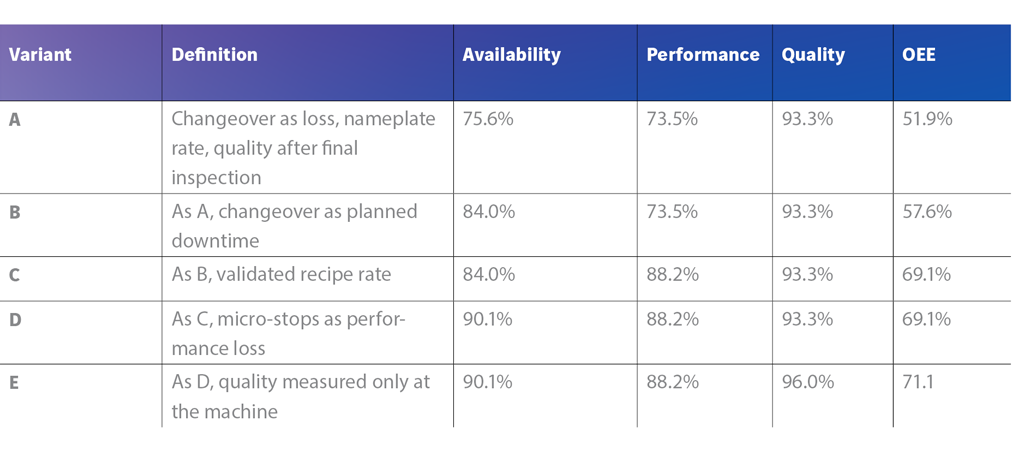
Nearly 20 percentage points separate the first row from the last. None of the five variants is wrong. The only mistake is to compare two of them.
Decision 5: How are the values aggregated?
Even with an identical calculation specification for each shift, values can diverge at plant or group level because they are aggregated differently. Three errors are common.
First, the simple average. Line 1 achieves 80% over 400 minutes of planned time, while line 2 achieves 50% over 100 minutes. The average is 65%. The correct approach is to total the value-adding time (good quantity multiplied by the reference cycle time) and the planned time separately, and only then divide them. This gives 74%.
Second, multiplying averaged factors. Anyone who averages availability, performance and quality over a month and multiplies the three averages will generally not obtain the OEE for the month, because the factors are based on different reference quantities.
Third, a line consisting of several stations. Multiplying the OEE values of all stations underestimates the line because blocking and starvation are counted multiple times. A line OEE that evaluates the good quantity at the end of the line using the bottleneck rate is more meaningful. The station values are then used for root-cause analysis.
What a robust calculation specification defines
Standards such as ISO 22400-2 and VDMA 66412-1 define the KPIs but leave room for interpretation when assigning times, thresholds and reference values. Each company must close this gap itself. There is no single correct OEE, but there can be a documented one. A calculation specification that applies to all plants should answer at least the following points:
- Reference time: which time categories are planned and which count as losses, including changeovers, maintenance, cleaning and missing material.
- Downtime threshold: the duration above which a stop counts as downtime and the granularity at which it is recorded.
- Reference rate: which value applies to each product or recipe, where it comes from and how changes are versioned.
- Quality counting: where quality is counted, how rework and start-up scrap are treated and when a value becomes final.
- Aggregation: how shifts, lines and plants are combined.
- Responsibility: who owns the specification and who approves changes.
The crucial point is that these definitions are not stored in a document alongside the system, but configured within the system itself. Only then will all plants calculate in the same way, and only then can a deviation still be explained a year later.
Why company-wide OEE is worthwhile
A standardised calculation specification initially requires coordination. It pays off as soon as more than one line, plant or machine series is involved. Four reasons take priority.
Comparability: Only when all plants calculate in the same way does a difference in OEE reflect a difference in operations rather than in booking logic. It then becomes clear which site performs best in changeovers, micro-stops or quality, and its approach can be transferred to other plants.
Investment decisions: Before purchasing an additional line, the question is how much capacity is available in the existing lines. This can be answered only if losses at all sites are available in the same categories. Otherwise, capacity may appear to exist merely because a different calculation method is being used.
Effort: If each plant maintains its own spreadsheets, the company-level figure is created at the end of the month through reconciliation and follow-up questions. A shared calculation based on the same data replaces this reconciliation, and management sees the same figure as the production line.
Installed base: For machine manufacturers, the benefits extend beyond their own plants. If all delivered machines calculate according to the same specification, systems at different customers can be compared, weaknesses in a machine series can be identified, and availability commitments in service contracts can be substantiated.
The AX IoT Suite provides this foundation on a single platform. The edge gateway reads machine data via standard interfaces such as OPC UA, Modbus TCP or MQTT. All sites send data to the same customer-owned Azure environment, while separate data spaces for each tenant keep plants or end customers apart. Through API-first integration, the production order, recipe and reference rate from ERP and MES are added. As no licence fees apply, the calculation scales with each additional line without additional licensing costs.
Every company must make these five decisions itself, regardless of the provider. The platform creates the conditions for applying them consistently across all sites.
Frequently asked questions
-
Which OEE definition is the right one?
-
Can the performance factor exceed 100%?
-
How is OEE aggregated across multiple lines?
CHRISTOPH ZINGG
Chief Commercial Officer, Axians 1stQuad AG

Talk to our IoT experts
Get a free demo and discover how the AX IoT Suite can help your business move forward.